The purpose of tables is to show data and its relationships, not to control layout. Learn why and how to create tables that are accessible by all.
Relationships
Screen readers do not have the visual cues that communicate relationships, so special code must be added to give those cues for users with visual challenges.
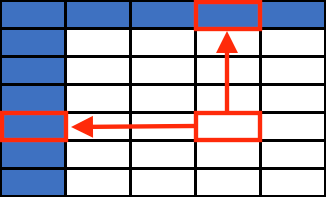
Reading order
Tables should make sense when read from top to bottom and left to right.
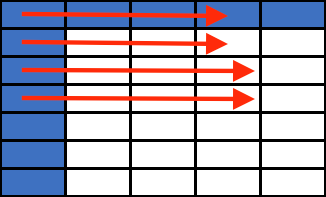
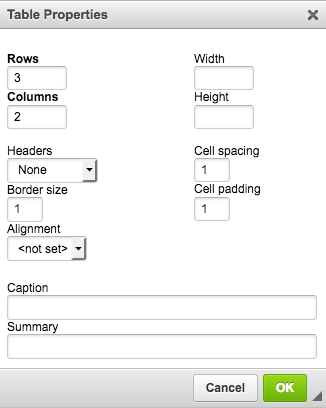
Row and Column Headers
Must have at least 1 row or 1 column designated as a header.
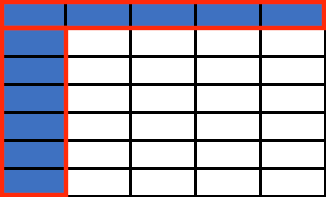
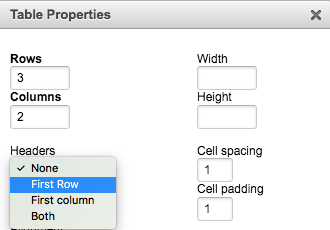
The text editor adds the code when you choose a Headers option under Table Properties.
Caption vs. Summary
Always provide a visible Caption, either a title or brief description of the content of the table.
The Summary invisibly describes the structure of a table and may not be needed.
Cheat sheet
- Keep it simple: avoid nested tables.
- Tables are for data: do not use them for layout.
- Leave width blank or use a percentage (e.g. 95%), for better scaling on mobile.
- Always indicate row or column headers.
- Add a caption for every table.
- Web Accessibility Tutorial on Tables from W3C